Saturday 23 June 2012

Opening a QVW Without the Data

I read a post on another blog earlier today about how to open a QVW file without its data and left a comment about an alternative way to achieve the same thing, so I thought I'd share it here too.

For those that have never come across this feature it can be useful when working with very large files that take a while to open and more importantly to recover a QVW file if the data in it has become corrupted for some reason. The latter is thankfully a rare occurrence but has been known. 

You can open a QVW without its data relatively easily by right clicking a document in the Recently Opened Documents list in the QlikView start page and selecting the option Open 'MyApplication' Without Data. The 'MyApplication' will be the name of the QVW file you selected.


If you've chosen to for the start page not to show you can get to it via the Help menu by selecting the option Show Start Page.

This method is fine if the document in question is one you've opened recently but if it's not then it won't be in your recent document list. Thankfully there is another way to open a document without the data using the command line parameter "nodata" as follows:

C:\Program Files\QlikView\qv.exe /nodata C:\MyFolder\MyApplication.qvw

If the code above appears on multiple lines then ignore that and type it all on a single line at the Windows command prompt. Obviously you'll need to modify the path to qv.exe and also the path to the file you are wanting to open.

A little tip that can come in handy once in a while.

Friday 15 June 2012

Automatically Leasing a License

Here is a quick QlikView tip for automatically leasing a license from a QlikView Server.

  1. Create a batch file containing the following:
    "C:\Program Files\QlikView\Qv.exe" /r "qvp://myQvServer/mySmallQvApp.qvw"
  2. Replace "C:\Program Files\QlikView\qv.exe" with the path to the qv.exe on your local computer.
  3. Replace "qvp://myQvServer/mySmallQvApp.qvw" with the server name and the name of a small application. You can always create a dummy application with no script or data just for this auto-leasing to use.
And that's it! You can schedule this to run on startup by placing the batch file in the Windows Startup folder, or over night each night using Windows Scheduler. The /r parameter asks QlikView to perform a reload of the application. As this is a server hosted document, QlikView won't be able to perform a reload and so will simply open QlikView, open the document and then close QlikView, leasing your license from the server in the process.

Tuesday 12 June 2012

Gantt Charts in QlikView

I've been asked more times than I can remember and seen countless posts on the QlikCommunity about how to produce gantt charts in QlikView. As with everything in QV there is more than one way to achieve a gantt chart but I thought I'd give a quick run through the most simple method.

The first thing you need is data, and more importantly data that contains 2 things, a start date and a duration. If you don't have a duration but you have an end date instead, you can calculate the duration by subtracting the latter from the former. For more on dates in QlikView see my earlier post on the subject. Once you have your data structured in this way, putting together the chart is simple. I used the following script to generate some random data for the charts shown in this post. Because the data is randomly generated, if you used this same script to experiment building a gantt chart with, don't expect your charts to show the same exact data.

Data:
LOAD
    TransID,
    chr(ord('A')+mod(TransID,26)) AS Category,
    date(monthstart(today()) + round(10*Rand1)) AS StartDate,
    ceil(10*Rand1) AS Duration;
LOAD
    rand() AS Rand1,
    recno() AS TransID
AUTOGENERATE 50;


Once I ran the this script I had a table of data that looked like this:


You can see I have the 2 key ingredients, a start date and a duration. With the data in place we can start to build our gantt chart. Added a new Chart object and QlikView should bring up its normal chart wizard for you to follow. The chart type we need to use is a bar chart and you may also want to give your chart a useful title before clicking "Next".


The first thing you need to do is add a dimension. This should be the field which contains the values for which you wish to have a bar in your gantt chart for each distinct value. This might be an activity or a project phase for example. In my example data I chose the Category field and clicked "Next".


Next we need to set our expression. The expression will give us the length of the bars displayed and because for a gantt chart we want this to represent the duration of the activity, we use our Duration field within the data. I used the following expression:

sum(Duration)
An important point to note is that I used the sum() function. This is because it may be possible to have more than one entry in my data for each Category and thus I wish to get the total duration of activities for the Category. Don't click on "Next" yet, we have one more thing to set about the expression.


As well as the length of the bar, we need to set the offset of the bars so that they don't all appear to start on the same date. To do this you need to click on the little + to the left of the expression you created do display the available expression properties. Within the "Bar Offset" property we need to define an expression to give us the starting position of each bar. In my example I used the following expression:

min(StartDate)
As before, I used the min() function to return the earliest date if there is more than one activity available for the Category. Once complete you can again click "Next".


You will now be asked to set a sort order for the dimension value should you need to. In my example I am happy with the default alphabetical sort order and so I clicked "Next" again to take me to the Style properties. The key to making my bar chart look like a gantt chart is to set the orientation to horizontal. You can choose to change to look and style of the bars if you wish to but for this example I left the defaults and clicked "Next".


There are a couple of presentation options that can make your gantt chart more user friendly. For example, I chose to limit the number of visible bars to 15 and to provide a scroll bar for users to view the rest should they wish. Don't click on "Next" just yet.


The other presentation option you may wish to add is a reference line showing today's date so that it is easy to identify within the chart. Click to add a new reference line and add the following expression:

=today()
You can change the look and feel of reference line if you wish but I left it standard for this example and clicked "OK".


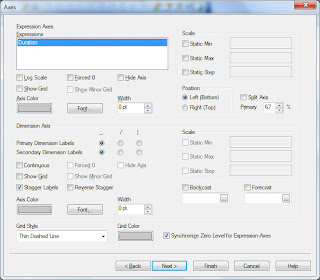
Once back at the presentation options you can now click on "Next" to take you to the Axes settings. There is one crucial setting we need to change and that is to unselect the "Force 0" option for the expression. If this is selected the chart will start from the QlikView base date of 30th December 1899 rather than a more sensible date based on the data you wish to display. You may also wish to set static minimum and maximum values for the scale and a grid for the expression to make the chart easier to view. Once complete click "Next" again.


You should now be presented with the Colour options. By default your bars will all be the same colour so you can change this here should you wish. For this example I kept the defaults and clicked "Next" again to take me to the Number settings. As your durations are numerical, QlikView will display numbers for the dates along the expression axes by default. We need to change this by selecting the expression and changing the format to Date. If your data is more granular you might want to use the Timestamp format instead to include time. We don't need to worry about any more settings in the wizard so we can click "Finish".


And that's it, you should hopefully have something that looks a little like the example I ended up with shown below. There are many other options to make your gantt chart more user friendly should you wish. For example you might want to include the duration of the bars as text on the data points or even as a popup. Have a play, the options are almost endless.


As I mentioned at the start, there are alternatives to achieve gantt charts in QlikView. For example, you could also use a third party charting tool to produce the gantt chart and embed it inside your document using an extension object. The method above is what I prefer to use and is the simplest to achieve using QlikView's inbuilt functionality.

Happy Gantting!

Thursday 7 June 2012

QViewer Review

I posted yesterday about downloading the newly released QViewer that allows you to view the contents of a QVD file without having to load it into a QlikView application. QViewer was produced by Dmitry Gudkov, a QlikView consultant from the Ukraine and released on his blog a couple of days ago. If you haven't yet, you can read his release post and also find a download link here http://bi-review.blogspot.co.uk/p/fast-qvd-viewer.html

It's worth pointing out that this is a demo version and Dmitry has this to say about it:
This is a technology demo which will be replaced with more functional self-updated version later.
So you can't expect a totally polished application, but from the few tests I've run with it so far, it's been pretty good.

The download is a Zip file and contains a number of files including a setup.exe. I extracted the archive and ran the executable. The install was quick (the entire Zip is only 230KB) and the application started itself afterwards. A simple menu across the top of the QViewer window presented me with the option to open a file. I clicked it, navigated to a QVD file and within a few seconds was presented with the contents of the file.


The next menu item on the menu allowed me to view the meta data for the QVD I had opened. As expected, clicking it presented me with another window telling me lots of useful information including the number of rows, the number of columns, the number of distinct values in the fields.


As well as this basic meta data, clicking on a column in the main QViewer window presented me with a small window showing all the distinct values within that column and more importantly, gave me the option to search within it.


It's worth mentioning that this search only effects this window and not the main QViewer window and so you can't use it to search for specific records, only distinct values within the selected field. Maybe that will be a good addition for the final version.

The only real issue I've found so far is that when opening a very large QVD (in excess of 1GB) I received an "Out of Memory" exception. This is likely because the application is compiled as a 32bit version and it simply hit the 2GB limit a single process can address on 32bit windows. Dmitry suggests that from his tests, a memory usage will be approximately 3 times the size of the QVD.

That aside, this is a great little tool and I think this will become even more useful with some tweaks and a 64bit version for the final release. I'll certainly be adding it to my QlikView toolbox.

QlikView for Notepad++ Update

NOTE: Links in this post are to deprecated versions, please see the QlikView Notepad++ page for the latest version and instructions.

I'm amazed to see that the QlikView language definition for Notepad++ has been downloaded over 200 times. Good to see there are so many people making use of it.

For those who haven't yet tried it you can read the instructions from the original post http://www.qlikviewaddict.com/2012/04/qlikview-scripts-in-notepad.html

For those that already have the first release you will need to download the new language definition file http://qvacb.googlecode.com/files/qlikview-lang-def-v0.3.xml

You'll need to follow pretty much the same steps as before but remove the old QlikView language definition file before importing the new one. You can do this by selecting "QlikView" in the User language drop down at the top of the User Defined Language dialog and then click "Remove". You can then import the new file following the same steps as before.

As before, if you find any issues leave me a comment below.

Wednesday 6 June 2012

QViewer

I'm just downloading the QVD Viewer produced by Dmitry Gudkov. It promises to allow you to open and view the contents of a QVD without having to load it into QlikView. Watch this space for how I get on but if you'd like to have a go yourself you can find more information and a download link at http://bi-review.blogspot.co.uk/p/fast-qvd-viewer.html