Extension objects are often seen an advanced QlikView topic and one
which only an experienced developer can tackle. This isn't necessarily
the case though and with a little explanation, anyone can build their
first QlikView extension object. In his blog post, my good friend
Stephen Redmond shows how to get a simple "Hello World" extension
object up and running in a matter of second.
http://qliktips.blogspot.co.uk/2011/01/beginners-guide-to-qlikview-extension.html
And if you want to follow the rest of his explanations to build a more useful extension object you can find more via these links:
http://qliktips.blogspot.co.uk/2011/01/beginners-guide-to-qlikview-extension_09.html
http://qliktips.blogspot.co.uk/2011/01/beginners-guide-to-qlikview-extension_4612.html
http://qliktips.blogspot.co.uk/2011/04/beginners-guide-to-qlikview-extension.html

Thursday, 19 July 2012

Tuesday, 17 July 2012
QlikViewAddict.com is the First QlikView Blog for Amazon Kindle
OK, so I might not have been posting as much as I'd like lately but I have been busy behind the scenes on a number of new additions to the site. One of which I'm very proud to launch today.
QlikViewAddict.com is the first QlikView blog available for the Amazon Kindle. Its easy to subscribe and any new posts will be automatically delivered to your kindle for you to read at your leisure. For those who have the pleasure of sitting on trains a lot like myself, my Kindle is a lifeline to keep me sane. Unfortunately, there is a small monthly subscription fee of just 99p. I'd love to provide it free (Amazon actually won't let me) but the subscription fee covers the cost of delivering updates to your Kindle automatically.

I'm still fine tuning the integration with Amazon, so expect the odd formatting error but hopefully these should be ironed out very soon.
To subscribe, simply click the Amazon Kindle logo on the right navigation bar, or search for "qlikviewaddict" in the Kindle Store on your Kindle device.
QlikViewAddict.com is the first QlikView blog available for the Amazon Kindle. Its easy to subscribe and any new posts will be automatically delivered to your kindle for you to read at your leisure. For those who have the pleasure of sitting on trains a lot like myself, my Kindle is a lifeline to keep me sane. Unfortunately, there is a small monthly subscription fee of just 99p. I'd love to provide it free (Amazon actually won't let me) but the subscription fee covers the cost of delivering updates to your Kindle automatically.
I'm still fine tuning the integration with Amazon, so expect the odd formatting error but hopefully these should be ironed out very soon.
To subscribe, simply click the Amazon Kindle logo on the right navigation bar, or search for "qlikviewaddict" in the Kindle Store on your Kindle device.
Friday, 13 July 2012
Dates in QlikView - Part 1
I've not been posting anywhere near as often as I would like, but in my defence I've have been rather busy trying to keep clients happy and make some progress on some new projects. So to get things rolling again here, I thought I'd write the first of a series of posts on dates. Don't worry, not the relationship kind, I'm not building a speed dating QlikView app, I tried but couldn't get hold of any data.
Handling date and timestamp data in QlikView seems to be one of the most common things people have difficulties with. It need not be difficult though and once you understand how dates are stored and a few simple facts about QlikView's inbuilt date and time functions you should have no problem at all. An important thing to note is that how QlikView stores dates is very similar to how most popular databases store them also and so the explanation I'm going to give here can be applied to some other technologies also.
The first thing you need to know about dates in QlikView is that they are really stored as a dual value. This value contains both a string (such as "01/01/2012") representing the date and number (such as "40909") defining the number of days since the epoch date. Dates prior to this base date are simply stored as a negative number of days. A common misconception is that the epoch date is 1st January 1900. What the epoch date is doesn't really matter to us when working with dates but for those that want to know, try creating a text object in QlikView and add the following expression:
The answer you get back should be 2 and from that we can see that the QlikView epoch date is in fact the same as the Oracle epoch date, 30th December 1899.
What does matter to us when working with dates is being able to calculate simple things such as the number of days between 2 dates. Thankfully this is simple because of the way QlikView stores dates, we can simply subtract one date from another to get our answer. QlikView is intelligent enough to know to use the number part of the stored date and the answer will give us the number of days between the two dates.
Timestamps are handled exactly the same as dates with one key difference, rather than being stored as an integer they include a decimal indicating the time as a fraction of a day. For example, today's date (13th July 2012) would be stored as an integer of 41103 and so midday today (12:00pm) would be 41103.5 (midday being 0.5 of a day). 5:15pm today would be 41103.71875 and so on. Just like date, timestamps are stored as a dual value.
A common thing to want to do is to create a data from a timestamp, effectively removing the time. At first glance this might seem simple as follows:
On the surface this appears to have worked correctly returning a date such as "13/07/2012". However, the date() function in QlikView is only a formatting function and thus affects only the string within the dual value stored. For example, midday today would be stored as both an numerical value of 41103.5 and a string "13/07/2012 12:00:00". Using the date function would not change the number but would change the string as expected to "13/07/2012". The problem with this is that when displaying values, QlikView will use the string if one exists, but when comparing values, QlikView will take the numerical value as priority. Because of this, two timestamps of different times on the same day may look the same when displayed, but will not be considered the same when QlikView is asked to compare them.
There is a simple solution to this problem, in fact there are 2 solutions. The first is to use the daystart() function which sets the time part of the timestamp (the decimal) to midnight (0). There is one issue with using the daystart() function and that is that it sets the string within the dual value as if it was a timestamp such as "13/07/2012 00:00:00". This can be solved by using the date() function to change the string formatting to just the date like this:
The alternative method to convert a timestamp to a date is a little more old school but effectively does exactly the same thing. Because a timestamp is stored as a number with a decimal, we can use the floor() function to remove the decimal and thus remove the time. However, like using the daystart() function, the floor function outputs a number without a string representation of the date and so we must again us the date function to format it correctly in to a dual value like this:
Which method you choose to use is completely up to you, there is no noticeable efficiency benefit of one method over the other.
In the next part we'll look at what to do if your database isn't storing proper dates and how to use the date interpretation functions date#, timestamp#, makedate and maketime to solve this problem.
Handling date and timestamp data in QlikView seems to be one of the most common things people have difficulties with. It need not be difficult though and once you understand how dates are stored and a few simple facts about QlikView's inbuilt date and time functions you should have no problem at all. An important thing to note is that how QlikView stores dates is very similar to how most popular databases store them also and so the explanation I'm going to give here can be applied to some other technologies also.
The first thing you need to know about dates in QlikView is that they are really stored as a dual value. This value contains both a string (such as "01/01/2012") representing the date and number (such as "40909") defining the number of days since the epoch date. Dates prior to this base date are simply stored as a negative number of days. A common misconception is that the epoch date is 1st January 1900. What the epoch date is doesn't really matter to us when working with dates but for those that want to know, try creating a text object in QlikView and add the following expression:
=num(makedate(1900,1,1))The answer you get back should be 2 and from that we can see that the QlikView epoch date is in fact the same as the Oracle epoch date, 30th December 1899.
What does matter to us when working with dates is being able to calculate simple things such as the number of days between 2 dates. Thankfully this is simple because of the way QlikView stores dates, we can simply subtract one date from another to get our answer. QlikView is intelligent enough to know to use the number part of the stored date and the answer will give us the number of days between the two dates.
Timestamps are handled exactly the same as dates with one key difference, rather than being stored as an integer they include a decimal indicating the time as a fraction of a day. For example, today's date (13th July 2012) would be stored as an integer of 41103 and so midday today (12:00pm) would be 41103.5 (midday being 0.5 of a day). 5:15pm today would be 41103.71875 and so on. Just like date, timestamps are stored as a dual value.
A common thing to want to do is to create a data from a timestamp, effectively removing the time. At first glance this might seem simple as follows:
date(MyTimestampField)On the surface this appears to have worked correctly returning a date such as "13/07/2012". However, the date() function in QlikView is only a formatting function and thus affects only the string within the dual value stored. For example, midday today would be stored as both an numerical value of 41103.5 and a string "13/07/2012 12:00:00". Using the date function would not change the number but would change the string as expected to "13/07/2012". The problem with this is that when displaying values, QlikView will use the string if one exists, but when comparing values, QlikView will take the numerical value as priority. Because of this, two timestamps of different times on the same day may look the same when displayed, but will not be considered the same when QlikView is asked to compare them.
There is a simple solution to this problem, in fact there are 2 solutions. The first is to use the daystart() function which sets the time part of the timestamp (the decimal) to midnight (0). There is one issue with using the daystart() function and that is that it sets the string within the dual value as if it was a timestamp such as "13/07/2012 00:00:00". This can be solved by using the date() function to change the string formatting to just the date like this:
date(daystart(MyTimestampField))The alternative method to convert a timestamp to a date is a little more old school but effectively does exactly the same thing. Because a timestamp is stored as a number with a decimal, we can use the floor() function to remove the decimal and thus remove the time. However, like using the daystart() function, the floor function outputs a number without a string representation of the date and so we must again us the date function to format it correctly in to a dual value like this:
date(floor(MyTimestampField))Which method you choose to use is completely up to you, there is no noticeable efficiency benefit of one method over the other.
In the next part we'll look at what to do if your database isn't storing proper dates and how to use the date interpretation functions date#, timestamp#, makedate and maketime to solve this problem.
Tuesday, 3 July 2012
Additional Gantt Chart Presentation
Chris over at oneqlikatatime.blogspot.co.uk has written a new blog post taking my early post on creating a basic gantt chart in QlikView and adding some additional design and presentation tweaks such as colouring the bars based on if they are active, past or pending. You can read it at http://oneqlikatatime.blogspot.co.uk/2012/07/qlikview-charts-with-colours.html
Saturday, 23 June 2012
Opening a QVW Without the Data
I read a post on another blog earlier today about how to open a QVW file without its data and left a comment about an alternative way to achieve the same thing, so I thought I'd share it here too.
For those that have never come across this feature it can be useful when working with very large files that take a while to open and more importantly to recover a QVW file if the data in it has become corrupted for some reason. The latter is thankfully a rare occurrence but has been known.
You can open a QVW without its data relatively easily by right clicking a document in the Recently Opened Documents list in the QlikView start page and selecting the option Open 'MyApplication' Without Data. The 'MyApplication' will be the name of the QVW file you selected.

If you've chosen to for the start page not to show you can get to it via the Help menu by selecting the option Show Start Page.
This method is fine if the document in question is one you've opened recently but if it's not then it won't be in your recent document list. Thankfully there is another way to open a document without the data using the command line parameter "nodata" as follows:
If the code above appears on multiple lines then ignore that and type it all on a single line at the Windows command prompt. Obviously you'll need to modify the path to qv.exe and also the path to the file you are wanting to open.
A little tip that can come in handy once in a while.
For those that have never come across this feature it can be useful when working with very large files that take a while to open and more importantly to recover a QVW file if the data in it has become corrupted for some reason. The latter is thankfully a rare occurrence but has been known.
You can open a QVW without its data relatively easily by right clicking a document in the Recently Opened Documents list in the QlikView start page and selecting the option Open 'MyApplication' Without Data. The 'MyApplication' will be the name of the QVW file you selected.

If you've chosen to for the start page not to show you can get to it via the Help menu by selecting the option Show Start Page.
This method is fine if the document in question is one you've opened recently but if it's not then it won't be in your recent document list. Thankfully there is another way to open a document without the data using the command line parameter "nodata" as follows:
C:\Program Files\QlikView\qv.exe /nodata C:\MyFolder\MyApplication.qvwIf the code above appears on multiple lines then ignore that and type it all on a single line at the Windows command prompt. Obviously you'll need to modify the path to qv.exe and also the path to the file you are wanting to open.
A little tip that can come in handy once in a while.
Friday, 15 June 2012
Automatically Leasing a License
Here is a quick QlikView tip for automatically leasing a license from a QlikView Server.
- Create a batch file containing the following:
"C:\Program Files\QlikView\Qv.exe" /r "qvp://myQvServer/mySmallQvApp.qvw"
- Replace "C:\Program Files\QlikView\qv.exe" with the path to the qv.exe on your local computer.
- Replace "qvp://myQvServer/mySmallQvApp.qvw" with the server name and the name of a small application. You can always create a dummy application with no script or data just for this auto-leasing to use.
Tuesday, 12 June 2012
Gantt Charts in QlikView
I've been asked more times than I can remember and seen countless posts on the QlikCommunity about how to produce gantt charts in QlikView. As with everything in QV there is more than one way to achieve a gantt chart but I thought I'd give a quick run through the most simple method.
The first thing you need is data, and more importantly data that contains 2 things, a start date and a duration. If you don't have a duration but you have an end date instead, you can calculate the duration by subtracting the latter from the former. For more on dates in QlikView see my earlier post on the subject. Once you have your data structured in this way, putting together the chart is simple. I used the following script to generate some random data for the charts shown in this post. Because the data is randomly generated, if you used this same script to experiment building a gantt chart with, don't expect your charts to show the same exact data.
Once I ran the this script I had a table of data that looked like this:

You can see I have the 2 key ingredients, a start date and a duration. With the data in place we can start to build our gantt chart. Added a new Chart object and QlikView should bring up its normal chart wizard for you to follow. The chart type we need to use is a bar chart and you may also want to give your chart a useful title before clicking "Next".

The first thing you need to do is add a dimension. This should be the field which contains the values for which you wish to have a bar in your gantt chart for each distinct value. This might be an activity or a project phase for example. In my example data I chose the Category field and clicked "Next".

Next we need to set our expression. The expression will give us the length of the bars displayed and because for a gantt chart we want this to represent the duration of the activity, we use our Duration field within the data. I used the following expression:
An important point to note is that I used the sum() function. This is because it may be possible to have more than one entry in my data for each Category and thus I wish to get the total duration of activities for the Category. Don't click on "Next" yet, we have one more thing to set about the expression.

As well as the length of the bar, we need to set the offset of the bars so that they don't all appear to start on the same date. To do this you need to click on the little + to the left of the expression you created do display the available expression properties. Within the "Bar Offset" property we need to define an expression to give us the starting position of each bar. In my example I used the following expression:
As before, I used the min() function to return the earliest date if there is more than one activity available for the Category. Once complete you can again click "Next".

You will now be asked to set a sort order for the dimension value should you need to. In my example I am happy with the default alphabetical sort order and so I clicked "Next" again to take me to the Style properties. The key to making my bar chart look like a gantt chart is to set the orientation to horizontal. You can choose to change to look and style of the bars if you wish to but for this example I left the defaults and clicked "Next".

There are a couple of presentation options that can make your gantt chart more user friendly. For example, I chose to limit the number of visible bars to 15 and to provide a scroll bar for users to view the rest should they wish. Don't click on "Next" just yet.

The other presentation option you may wish to add is a reference line showing today's date so that it is easy to identify within the chart. Click to add a new reference line and add the following expression:
You can change the look and feel of reference line if you wish but I left it standard for this example and clicked "OK".

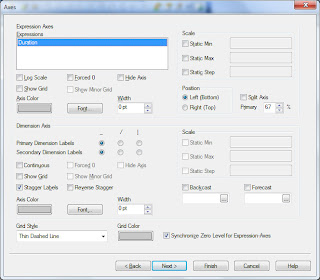
Once back at the presentation options you can now click on "Next" to take you to the Axes settings. There is one crucial setting we need to change and that is to unselect the "Force 0" option for the expression. If this is selected the chart will start from the QlikView base date of 30th December 1899 rather than a more sensible date based on the data you wish to display. You may also wish to set static minimum and maximum values for the scale and a grid for the expression to make the chart easier to view. Once complete click "Next" again.
You should now be presented with the Colour options. By default your bars will all be the same colour so you can change this here should you wish. For this example I kept the defaults and clicked "Next" again to take me to the Number settings. As your durations are numerical, QlikView will display numbers for the dates along the expression axes by default. We need to change this by selecting the expression and changing the format to Date. If your data is more granular you might want to use the Timestamp format instead to include time. We don't need to worry about any more settings in the wizard so we can click "Finish".

And that's it, you should hopefully have something that looks a little like the example I ended up with shown below. There are many other options to make your gantt chart more user friendly should you wish. For example you might want to include the duration of the bars as text on the data points or even as a popup. Have a play, the options are almost endless.

As I mentioned at the start, there are alternatives to achieve gantt charts in QlikView. For example, you could also use a third party charting tool to produce the gantt chart and embed it inside your document using an extension object. The method above is what I prefer to use and is the simplest to achieve using QlikView's inbuilt functionality.
Happy Gantting!
The first thing you need is data, and more importantly data that contains 2 things, a start date and a duration. If you don't have a duration but you have an end date instead, you can calculate the duration by subtracting the latter from the former. For more on dates in QlikView see my earlier post on the subject. Once you have your data structured in this way, putting together the chart is simple. I used the following script to generate some random data for the charts shown in this post. Because the data is randomly generated, if you used this same script to experiment building a gantt chart with, don't expect your charts to show the same exact data.
Data:

LOAD

    TransID,

    chr(ord('A')+mod(TransID,26)) AS Category,

    date(monthstart(today()) + round(10*Rand1)) AS StartDate,

    ceil(10*Rand1) AS Duration;

LOAD

    rand() AS Rand1,

    recno() AS TransID

AUTOGENERATE 50;
Once I ran the this script I had a table of data that looked like this:

You can see I have the 2 key ingredients, a start date and a duration. With the data in place we can start to build our gantt chart. Added a new Chart object and QlikView should bring up its normal chart wizard for you to follow. The chart type we need to use is a bar chart and you may also want to give your chart a useful title before clicking "Next".

The first thing you need to do is add a dimension. This should be the field which contains the values for which you wish to have a bar in your gantt chart for each distinct value. This might be an activity or a project phase for example. In my example data I chose the Category field and clicked "Next".

Next we need to set our expression. The expression will give us the length of the bars displayed and because for a gantt chart we want this to represent the duration of the activity, we use our Duration field within the data. I used the following expression:
sum(Duration)
An important point to note is that I used the sum() function. This is because it may be possible to have more than one entry in my data for each Category and thus I wish to get the total duration of activities for the Category. Don't click on "Next" yet, we have one more thing to set about the expression.

As well as the length of the bar, we need to set the offset of the bars so that they don't all appear to start on the same date. To do this you need to click on the little + to the left of the expression you created do display the available expression properties. Within the "Bar Offset" property we need to define an expression to give us the starting position of each bar. In my example I used the following expression:
min(StartDate)
As before, I used the min() function to return the earliest date if there is more than one activity available for the Category. Once complete you can again click "Next".

You will now be asked to set a sort order for the dimension value should you need to. In my example I am happy with the default alphabetical sort order and so I clicked "Next" again to take me to the Style properties. The key to making my bar chart look like a gantt chart is to set the orientation to horizontal. You can choose to change to look and style of the bars if you wish to but for this example I left the defaults and clicked "Next".

There are a couple of presentation options that can make your gantt chart more user friendly. For example, I chose to limit the number of visible bars to 15 and to provide a scroll bar for users to view the rest should they wish. Don't click on "Next" just yet.

The other presentation option you may wish to add is a reference line showing today's date so that it is easy to identify within the chart. Click to add a new reference line and add the following expression:
=today()
You can change the look and feel of reference line if you wish but I left it standard for this example and clicked "OK".

Once back at the presentation options you can now click on "Next" to take you to the Axes settings. There is one crucial setting we need to change and that is to unselect the "Force 0" option for the expression. If this is selected the chart will start from the QlikView base date of 30th December 1899 rather than a more sensible date based on the data you wish to display. You may also wish to set static minimum and maximum values for the scale and a grid for the expression to make the chart easier to view. Once complete click "Next" again.

You should now be presented with the Colour options. By default your bars will all be the same colour so you can change this here should you wish. For this example I kept the defaults and clicked "Next" again to take me to the Number settings. As your durations are numerical, QlikView will display numbers for the dates along the expression axes by default. We need to change this by selecting the expression and changing the format to Date. If your data is more granular you might want to use the Timestamp format instead to include time. We don't need to worry about any more settings in the wizard so we can click "Finish".

And that's it, you should hopefully have something that looks a little like the example I ended up with shown below. There are many other options to make your gantt chart more user friendly should you wish. For example you might want to include the duration of the bars as text on the data points or even as a popup. Have a play, the options are almost endless.

As I mentioned at the start, there are alternatives to achieve gantt charts in QlikView. For example, you could also use a third party charting tool to produce the gantt chart and embed it inside your document using an extension object. The method above is what I prefer to use and is the simplest to achieve using QlikView's inbuilt functionality.
Happy Gantting!
Subscribe to:
Posts (Atom)